PHP Builtin Webserver and Xdebug
When it comes to programming the developer usually reaches a point where something doesn't work as expected
and the code needs to be debugged. The easiest way of debugging is to place some var_dump() statements
with variables inside the code, run it and see the output of these dumps. A similar approach is to use
the print_r() statement. Both display the content of a variable in a human-readable way at standard output,
usually the webpage or console where you run the code.
Built-in debug possibilities
Assume we have the following code in a test.php script:
<?php
$obj = new stdClass();
$obj->one = "1";
$obj->two = "2";
$arr = ['first', 'second', 'third'];
echo 'Output of print_r($obj); and print_r($arr):' . PHP_EOL;
print_r($obj);
print_r($arr);
echo 'Output of var_dump($obj, $arr);:' . PHP_EOL;
var_dump($obj, $arr);
The output of the script is the following:
Output of print_r($obj); and print_r($arr):
stdClass Object
(
    [one] => 1
    [two] => 2
)
Array
(
    [0] => first
    [1] => second
    [2] => third
)
Output of var_dump($obj, $arr);:
/home/user/test.php:10:
class stdClass#1 (2) {
  public $one =>
  string(1) "1"
  public $two =>
  string(1) "2"
}
/home/user/test.php:10:
array(3) {
  [0] =>
  string(5) "first"
  [1] =>
  string(6) "second"
  [2] =>
  string(5) "third"
}
Both outputs are readable by a human even though the printed information slightly differs. Note that var_dump also
includes the information where the statement actually is located in your code but does not traverse very deep into
data (multidimensional arrays, objects) and also ommits large data sets (shortens strings, arrays). In one var_dump
call you can provide several variables at once as function arguments to dump the information. In contrast, the
print_r() statement accepts a second boolean argument. When set to true the output is not immediately printed to
stdout but rather returned by the function and can be stored in a variable for further processing. Also print_r
does not shorten the output for better readability.
The drawback when using these functions is that your code is modified, and you need to remove them after successfully debugging your code. Also, when you don't know exactly where your problem lies, and you might place the debug functions at the wrong code part. In this case you need to move the debug functions to some other place, rerun the code, and check the output again. This is tedious and time-consuming work. The whole process can be accelerated by using a debugger. Also, using a debugger lets you run the code once, set a break point and then step through each code line and jump into a function when called while watching the variables in the scope.
Write custom logs on production environments
In some cases when you are on a production environment, you just can't use any debug output because that would be visible by any visitor of the site and also may break javascript code, because the delivered HTML might become invalid because of the debug output.
In such cases I write a log file like this:
file_put_contents('/tmp/debug.log',
    (new \DateTime())->format('Y-m-d H:i:s.u') . ' '
    . __FILE__ . ':' . __LINE__ . ' ' . json_encode($var)
    . PHP_EOL, FILE_APPEND);
Some things to note here:
- The logfile is written to the system temp dir. It's very important to use a directory where the webserver has write access to. When you edit the file, you may have more privileges than the ordinary www-user or whoever the webserer is running with. It breaks your application if the output cannot be written to the debug log because of insufficient rights.
- The variable (or variables) are encoded as a json string. This might not look very readable at first but usually contains all necessary information, especially when you store object instances. A drawback with the json approach is that you do not see the class name of an instance.
Install and Setup Xdebug
PHP has two common debuggers, the Zend Debugger and Xdebug. I prefer the latter. First make sure that xdebug is installed:
$ php -v
PHP 8.2.1 (cli) (built: Jan 13 2023 10:38:46) (NTS)
Copyright (c) The PHP Group
Zend Engine v4.2.1, Copyright (c) Zend Technologies
    with Zend OPcache v8.2.1, Copyright (c), by Zend Technologies
    with Xdebug v3.2.0, Copyright (c) 2002-2022, by Derick Rethans
If you don't see any hint of Xdebug in the version output, then install it (on Debian based systems) with the following command:
sudo apt install php8.2-xdebug
For a local project that I am developing I run the PHP builtin Webserver. In general the call of PHP with the
webserver builtin is done by calling the php executable as php -S localhost:80. When you call
http://localhost/test.php in your browser, the PHP process should serve the test.php from the document root,
that is the directory where the php process was started. In the open terminal you will see all access and
errors that are logged by the webserver. The log may look like this:
[Sun Feb  5 17:40:58 2023] PHP 8.2.1 Development Server (http://localhost:8000) started
[Sun Feb  5 17:41:09 2023] [::1]:44022 Accepted
[Sun Feb  5 17:41:14 2023] [::1]:44022 [200]: GET /test.php
[Sun Feb  5 17:41:14 2023] [::1]:44022 Closing
In my environment I rather use the port 8000 to run the webserver. Also in order to make sure that Xdebug is
correctly configured I use a custom php.ini with some settings that I have defined there. The little start
script runs php in the project root directory. The document root directory is named public and resides in
the project root directory.
#!/bin/bash
DIR="$( cd "$( dirname "${BASH_SOURCE[0]}" )" && pwd )"
php -c ${DIR}/php.ini -S localhost:8000 -t ${DIR}/public
This starts the php webserver in the project root, -c points to the custom php.ini where the Xdebug settings
are set. The argument -t points to the document root, and we use the port 8000. The php.ini with the xdebug
settings looks like this:
xdebug.mode=debug
xdebug.var_display_max_depth = 100
xdebug.idekey = xdebug
xdebug.client_host = 127.0.0.1
xdebug.client_port = 9003
xdebug.start_with_request = yes
xdebug.discover_client_host = 1
You don't need all of these settings, because e.g. the port 9003 is the default value. However, if you want to stick to the old port 9000, the settings key is included here for documentary reasons.
You may also omit the php.ini and set the relevant xdebug parameters
on the command line:
#!/bin/bash
DIR="$( cd "$( dirname "${BASH_SOURCE[0]}" )" && pwd )"
php -S localhost:8000 -t ${DIR}/public \
  -d xdebug.mode=debug \
  -d xdebug.var_display_max_depth=100 \
  -d xdebug.idekey=xdebug \
  -d xdebug.client_host=127.0.0.1 \
  -d xdebug.client_port=9003 \
  -d xdebug.start_with_request=yes \
  -d xdebug.discover_client_host=1
The handling is similar as with the ini file. All settings from the
ini file must be submitted via the -d argument switch. Note that on
the command line no spaces must be in the argument. Otherwise, encapsulate
the argument with quotes.
Prior to version 3 of xdebug, the settings in the ini file looked like this:
xdebug.mode=debug
xdebug.var_display_max_depth = 100
xdebug.idekey = xdebug
xdebug.remote_enable = 1
xdebug.remote_host = 127.0.0.1
xdebug.remote_port = 9000
xdebug.remote_connect_back=1
xdebug.remote_autostart=1
Docker setup
In case you have a project using docker, then the xdebug.client_host should be set
to host.docker.internal. This value is also used in the docker container setup.
Your docker compose file should contain the following entries in the service section
that defines the setup of the webserver:
extra_hosts:
  - host.docker.internal:host-gateway
expose:
  - 9003
Setup your IDE
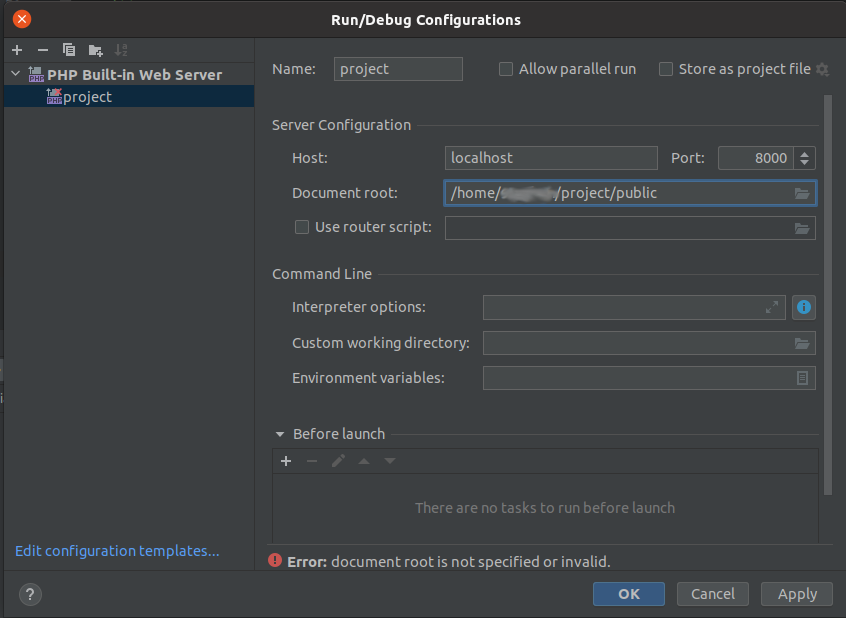
If the webserver is running, set up your IDE (in my case I use PhpStorm) for the debug session. PhpStorm comes with a variety of templates for setting up the debugger.

In this screenshot the PHP Build-in Web Server template is used. If you have a docker setup, the template that you would use is PHP Remote Debug because the webserver is running in the docker container and not directly on your machine. Also then you need to define the mapping, where your code is located on the webserver and on your local machine.
Start a debug session
To actually debug the code now, run a request in the browser. The debugger is triggered when the parameter
XDEBUG_SESSION_START=1 is send. Append it to the url either with ? if there are no GET parameters there yet,
or use & to append it to existing GET parameters. A sample call would look like
http://localhost:8000/test.php?XDEBUG_SESSION_START=1.
It's more convenient to use a browser addon like Xdebug Helper for Firefox that lets you toggle the debugging mode. This addon sets a cookie when enabled and with each request an additional HTTP header is set. That eliminates the query parameter that is required otherwise.
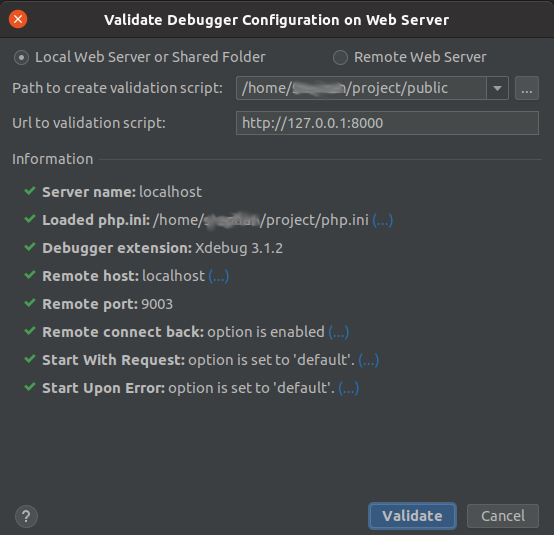
If something does not work in PhpStorm you have the chance to run a diagnosis to check the preconditions. Open the following dialogue via Run -> Web Server Debug Validation.

If there is a checkmark missing, the program usually has more information where to look further to fix the problem. If everything looks good like in the screenshot you are ready to go. Happy debugging and be more productive in your software developing process.
Changelog:
- 2024-02-10: add section for custom log file, add cli args with -d for ini settings.
- 2023-02-08: update php.ini config and logs to match settings of xdebug version 3, added settings for docker.